We analyzed $832,168,240 in church donations to identify the most important church giving statistics.
Here’s what we compiled and what you’re about to learn:
Average donation size
Typical donation frequency
The most and least popular times to give
Recurring giving enrollment percentage
Preferred giving methods
The average amount of a donation lost to fees
Want all of this information in a downloadable report?
We’ve got you there. Below you’ll find The Church Giving Statistics 2026 Report assembled for download so you can keep a copy for yourself.
Ready to dive into the numbers?
Let’s get started.
{{banner-1}}
How we uncovered these numbers
The data in this annual report is not speculative. It’s also not a compilation of stats from around the web.
So what is it?
We mined over almost a billion dollars in real donations to churches that we processed ourselves through Nucleus Giving – our giving platform for churches.
These are our actual numbers! We’re pulling back the curtain.
To that end, here are a few important considerations as you look through our numbers:
These donations were made to churches of all sizes in both the United States and Canada
All gifts were processed online via bank account or credit card
The final day of giving tallied in this report was December 31st, 2025
Here’s what we found…
Church Giving Statistic #1 – Average Donation Size = $215
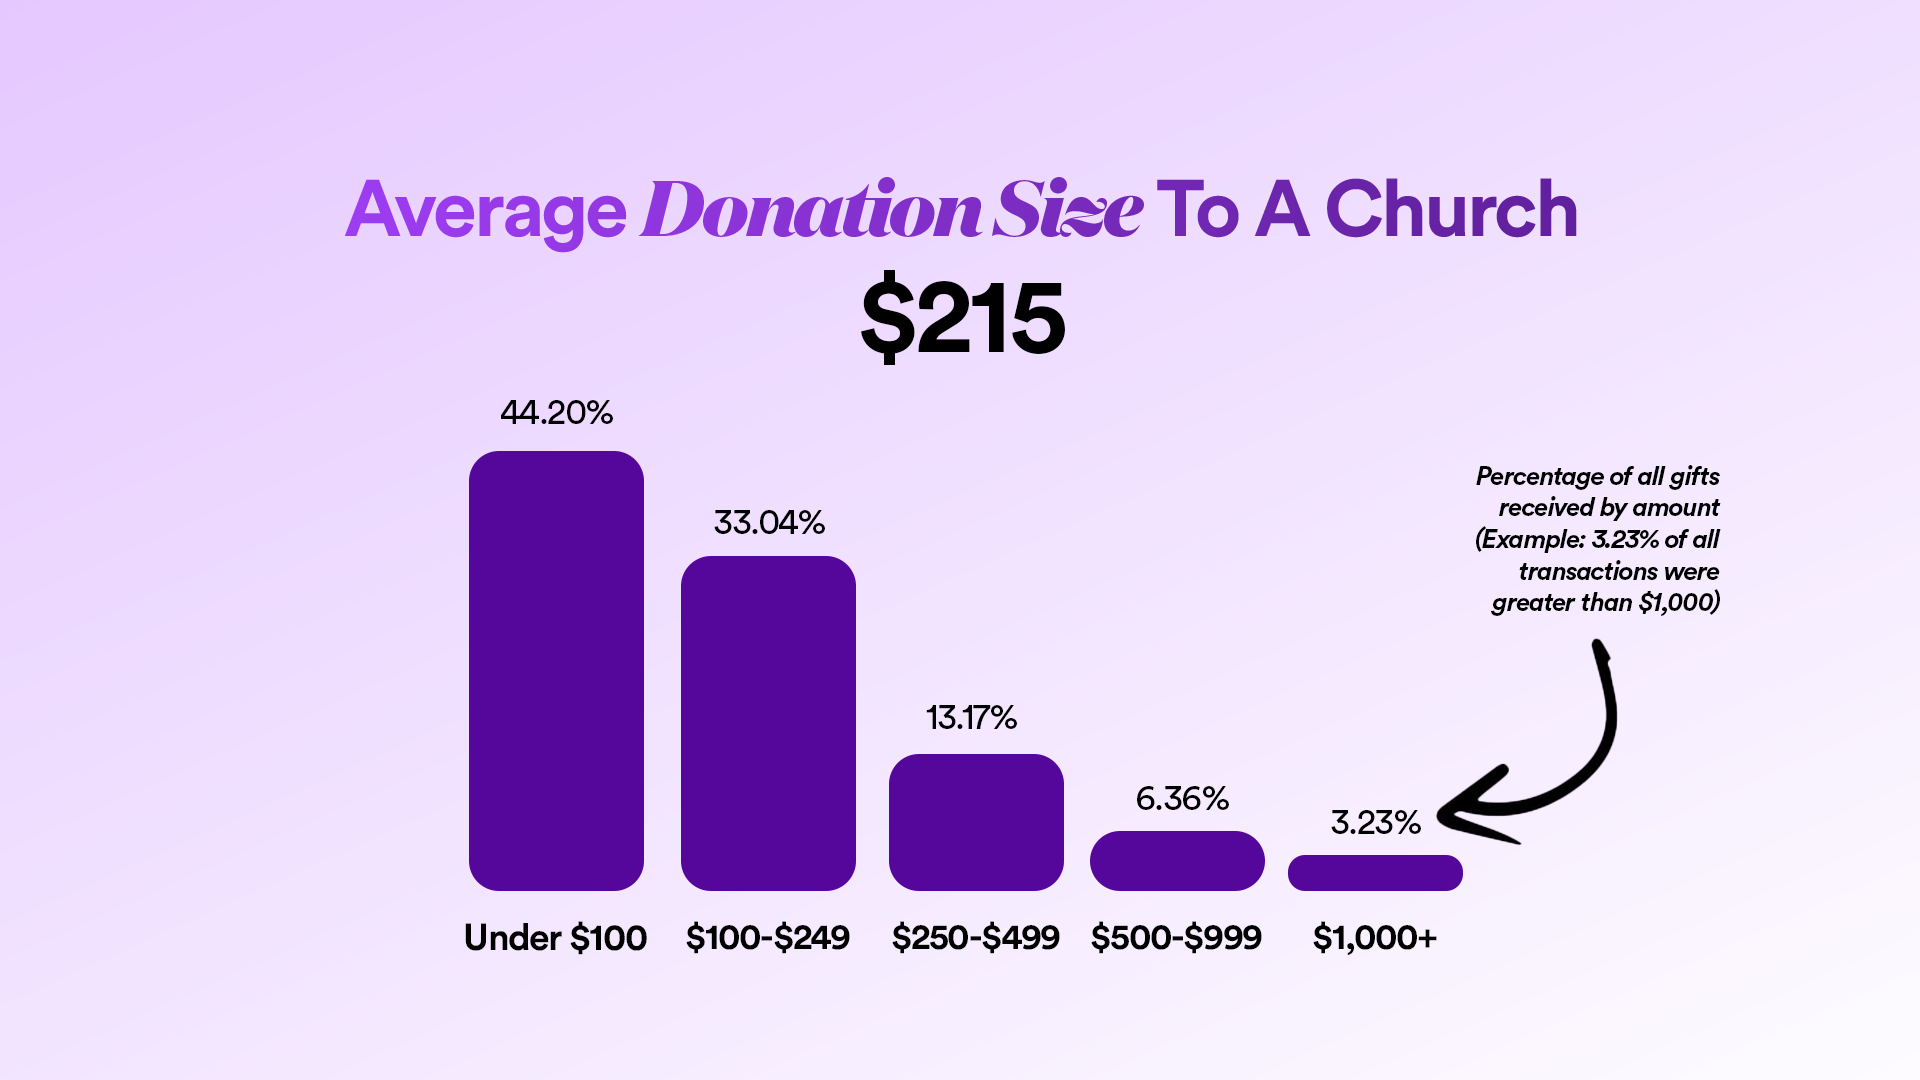
The average donation to a church is $215.
Average Donaion Size To A Church
Here’s the breakdown by gift amount:
44.20% of all gifts are under $100
33.04% of gifts are between $100-$249
13.17% of gifts are between $250-$499
6.36% of gifts are between $500-$999
3.23% of gifts are greater than $1,000
Here’s where things get interesting…
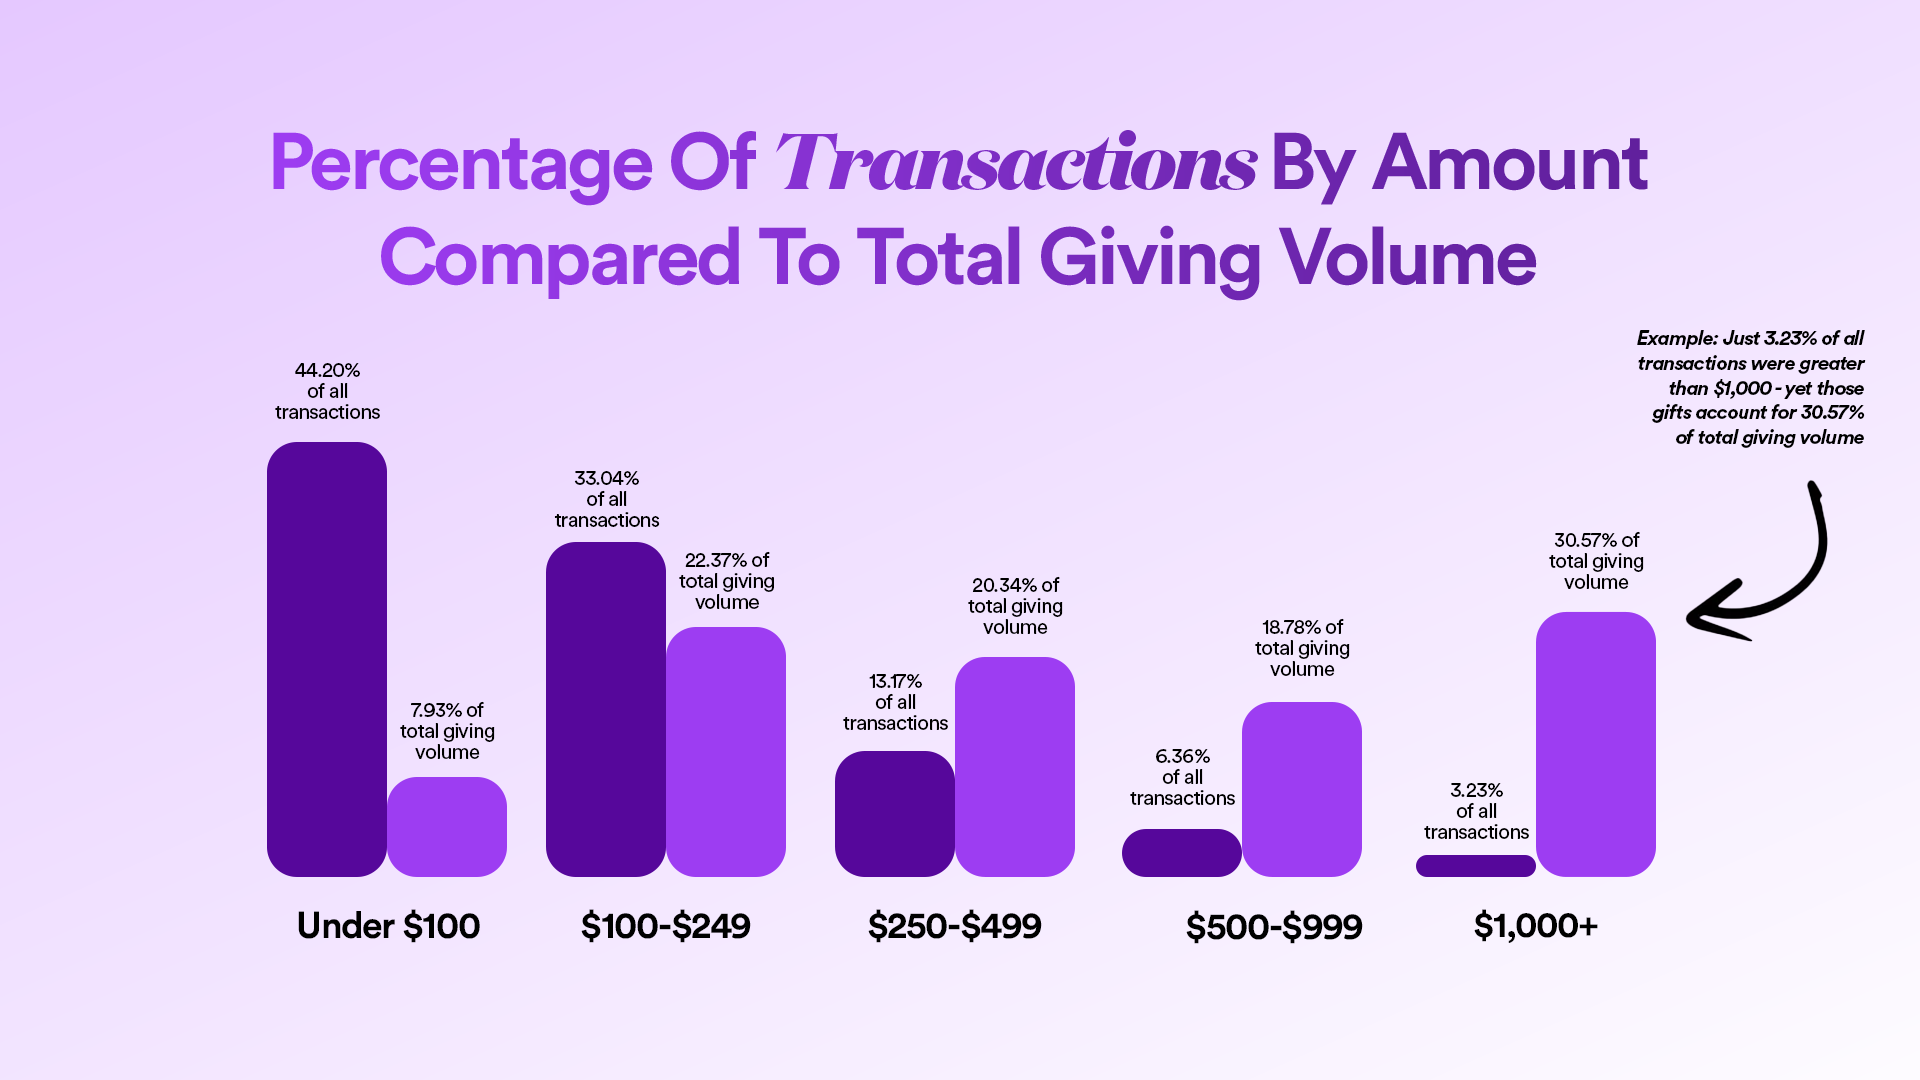
Because while 44.20% of gifts are under $100, that translates to just 7.93% of overall giving volume.
And while only 3.23% of all gifts are over $1,000, that accounts for 30.57% of overall giving volume.
Percentage Of Transactions By Amount Compared To Giving Volume
And perhaps this shouldn’t be surprising.
But for me, at least, I did not expect to see such extreme disparity between the two ends of the spectrum.
Church Giving Statistic #2 – Typical Donation Frequency
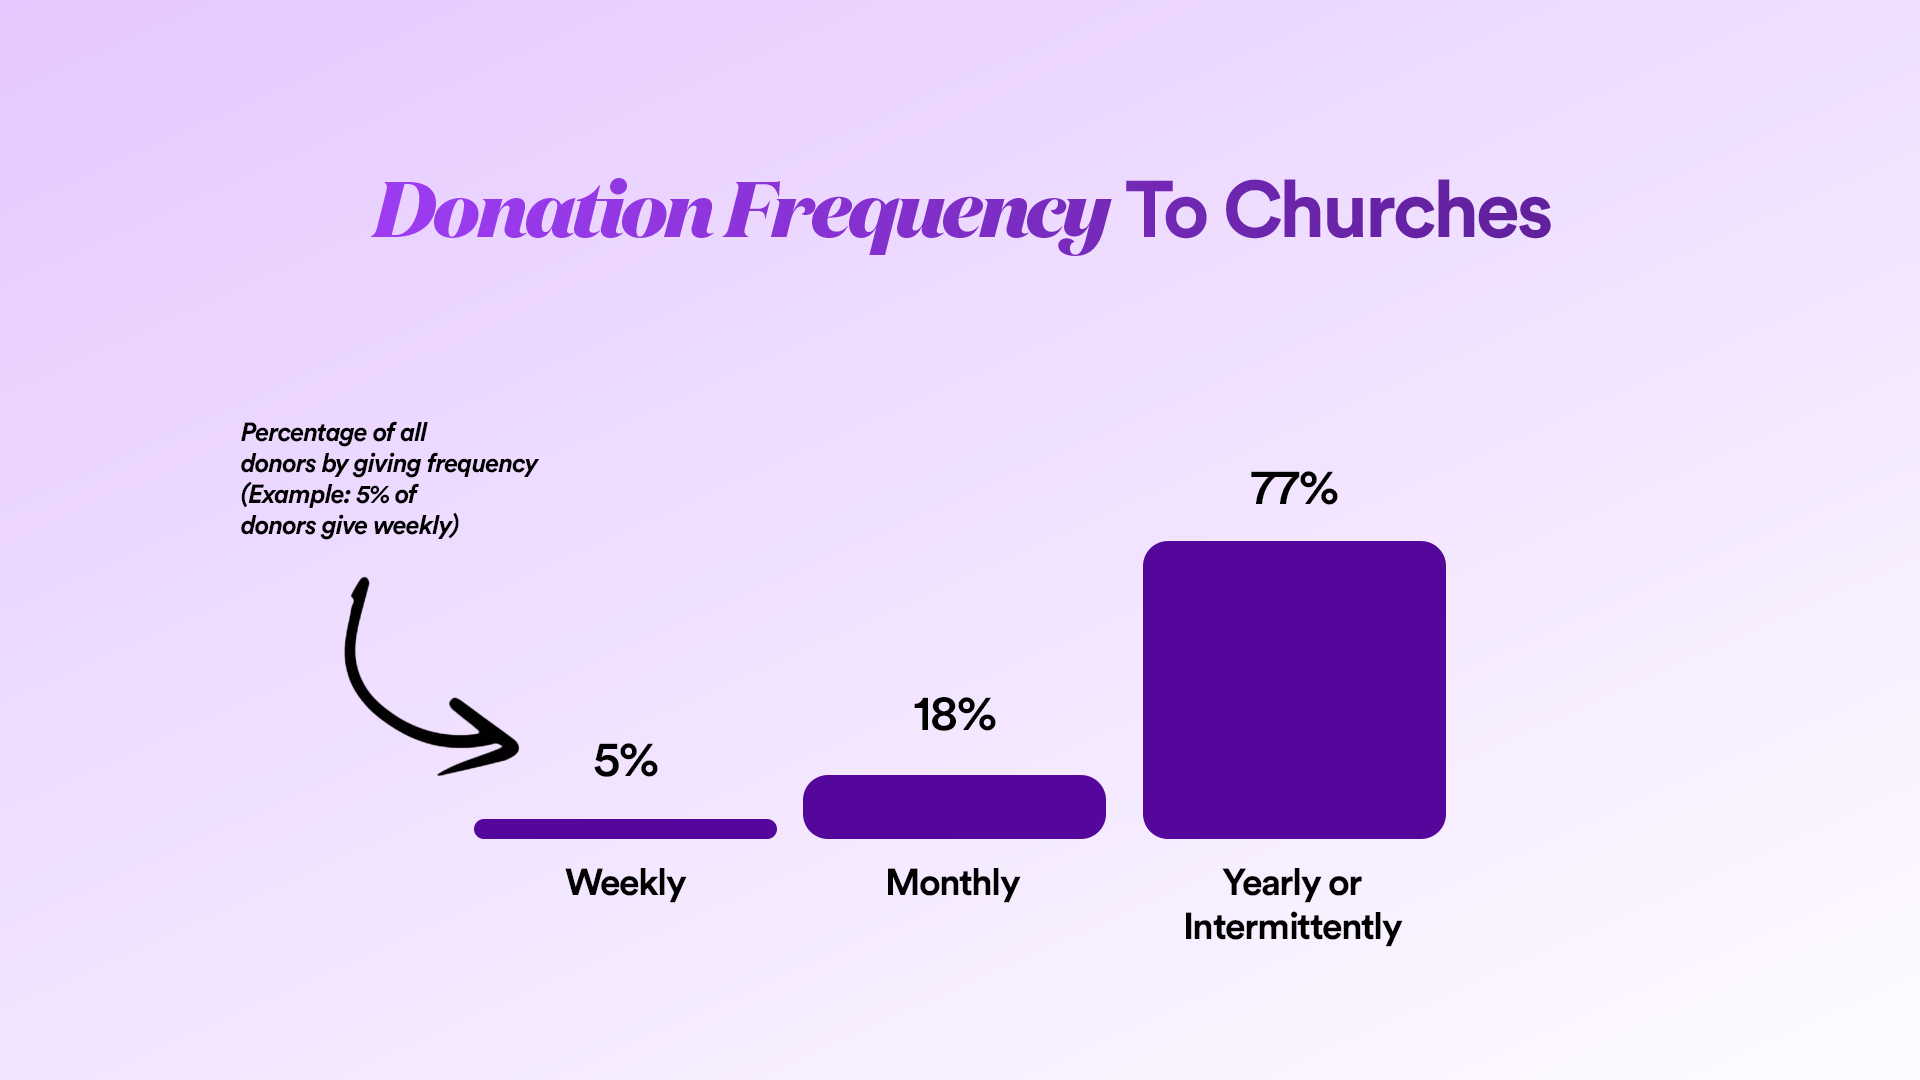
Of all givers:
6% give weekly
18% give monthly
76% give yearly or intermittently
Donation Frequency To Churches
But how does giving frequency translate to giving volume?
Surely the 76.32% of yearly/intermittent givers are contributing the largest amounts – right?
Evidently not.
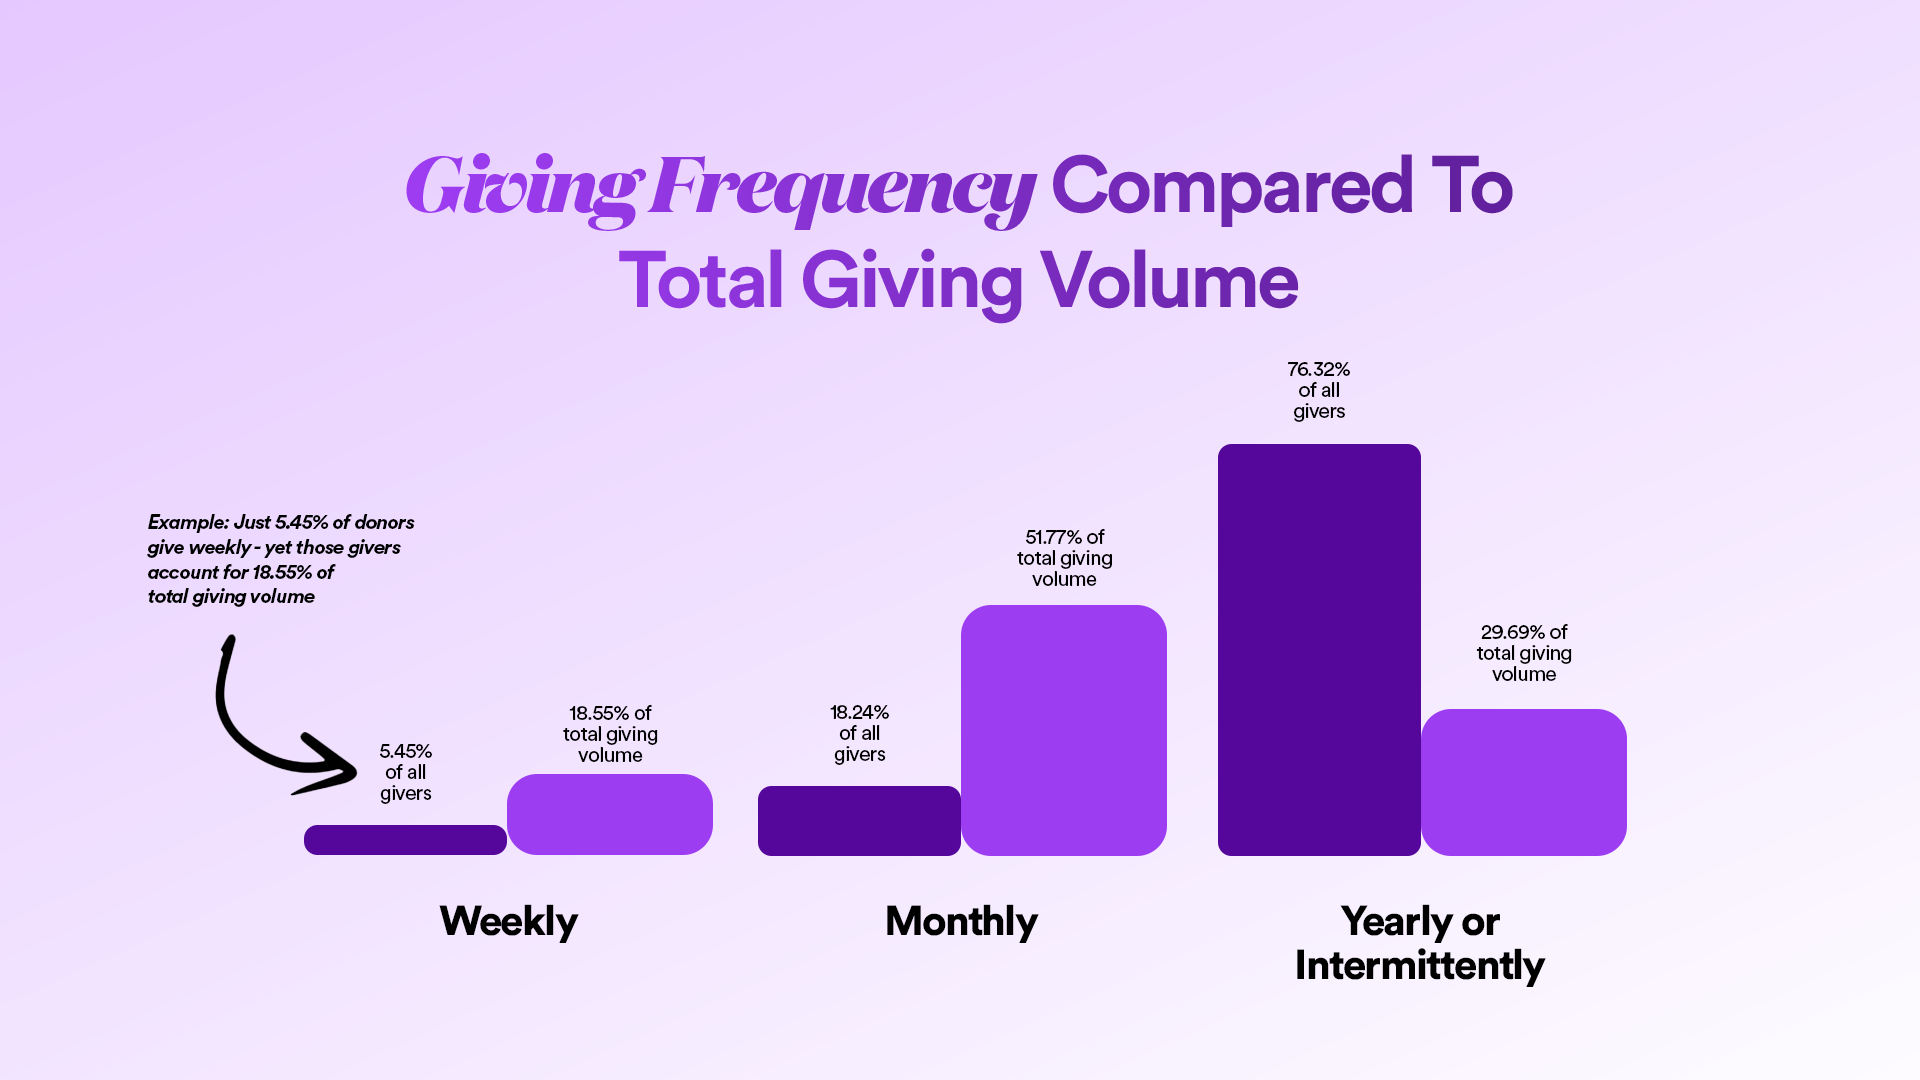
Giving Frequency Compared To Total Giving Volume
On the contrary, it’s the weekly and monthly givers that are doing the heavy lifting. Even though they make up just over ~20% of givers.
To make a point:
Only 5.45% of givers donate weekly – but those givers contribute 18.55% of total giving
Just 18.24% of givers donate monthly – but those givers contribute 51.77% of total giving
And despite 76.32% of givers donating yearly or intermittently – that translates to just 29.69% of total giving
This foreshadows what we’ll see with recurring givers shortly, but here’s the bottom line:
It’s the folks that show up month after month that are contributing the most.
And this tracks with other areas of ministry and Christian service beyond giving, right?
It’s the people that serve regularly, that attend regularly, that participate regularly – the fully-integrated parishioners in our churches are doing the heavy lifting.
{{banner-2}}
Church Giving Statistic #3 – The Most & Least Popular Times To Give
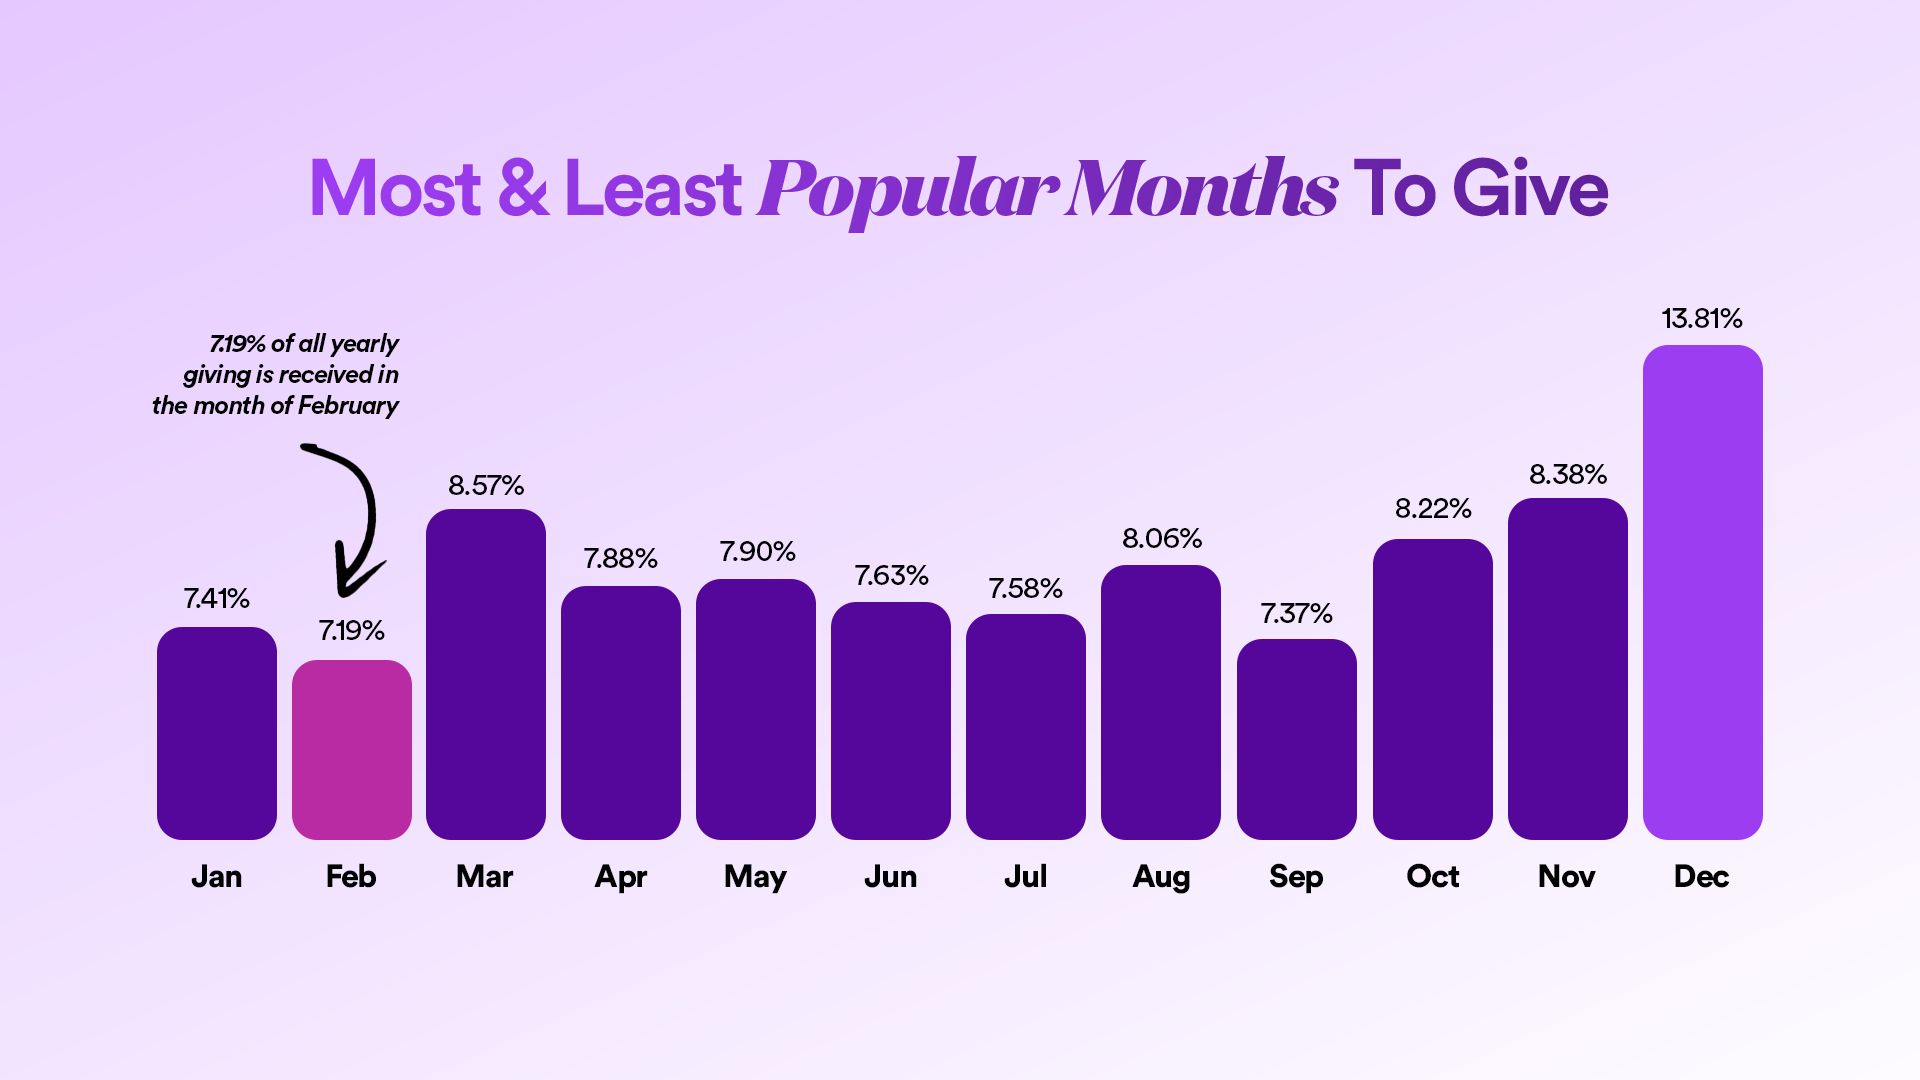
Here are the most and least popular months of the year to give – with February seeing the lowest amount of giving volume (a change from last year where January saw the lowest volume) and December unsurprisingly seeing the highest:
January = 7.41%
February = 7.19%(the lowest giving month)
March = 8.57%
April = 7.88%
May = 7.90%
June = 7.63%
July = 7.58%
August = 8.06%
September = 7.37%
October = 8.22%
November = 8.38%
December = 13.81% (the highest giving month)
Most & Least Popular Month To Give
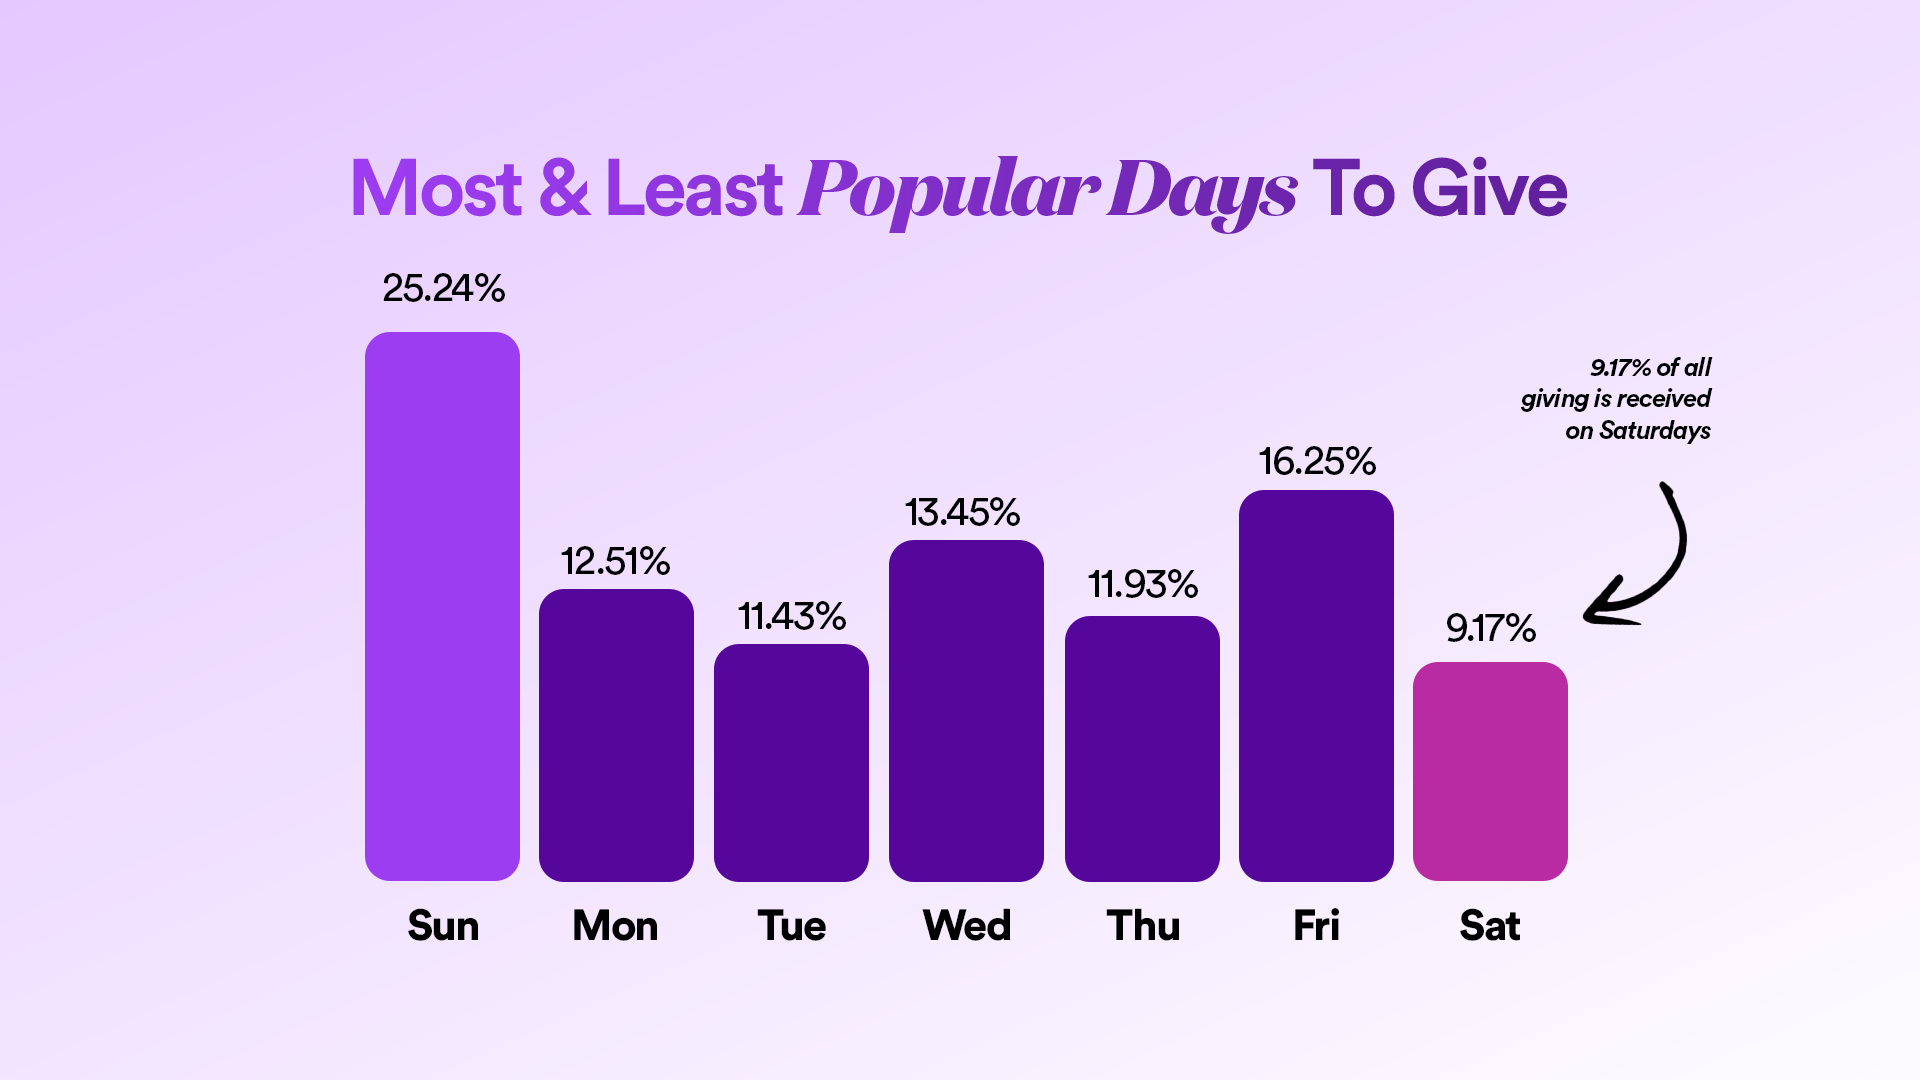
Let’s turn our attention now to the most and least popular days of the week to donate to churches. And here’s what’s interesting:
Yes, Sunday is the most popular day of the week to give to churches – but in the aggregate, more than 70% of all giving happens outside of Sunday.
Here are the specifics:
Sunday = 25.25% (the most popular day of the week to give to churches)
Monday = 12.51%
Tuesday = 11.43%
Wednesday = 13.45%
Thursday = 11.93%
Friday = 16.25%
Saturday = 9.17% (the least popular day of the week to give)
Notably, and somewhat inexplicably, Wednesday took a sizeable jump this year, from the second-least popular day to give in 2024 (10.79%) to the third-most popular this year (13.45%).
Most & Least Popular Days To Give
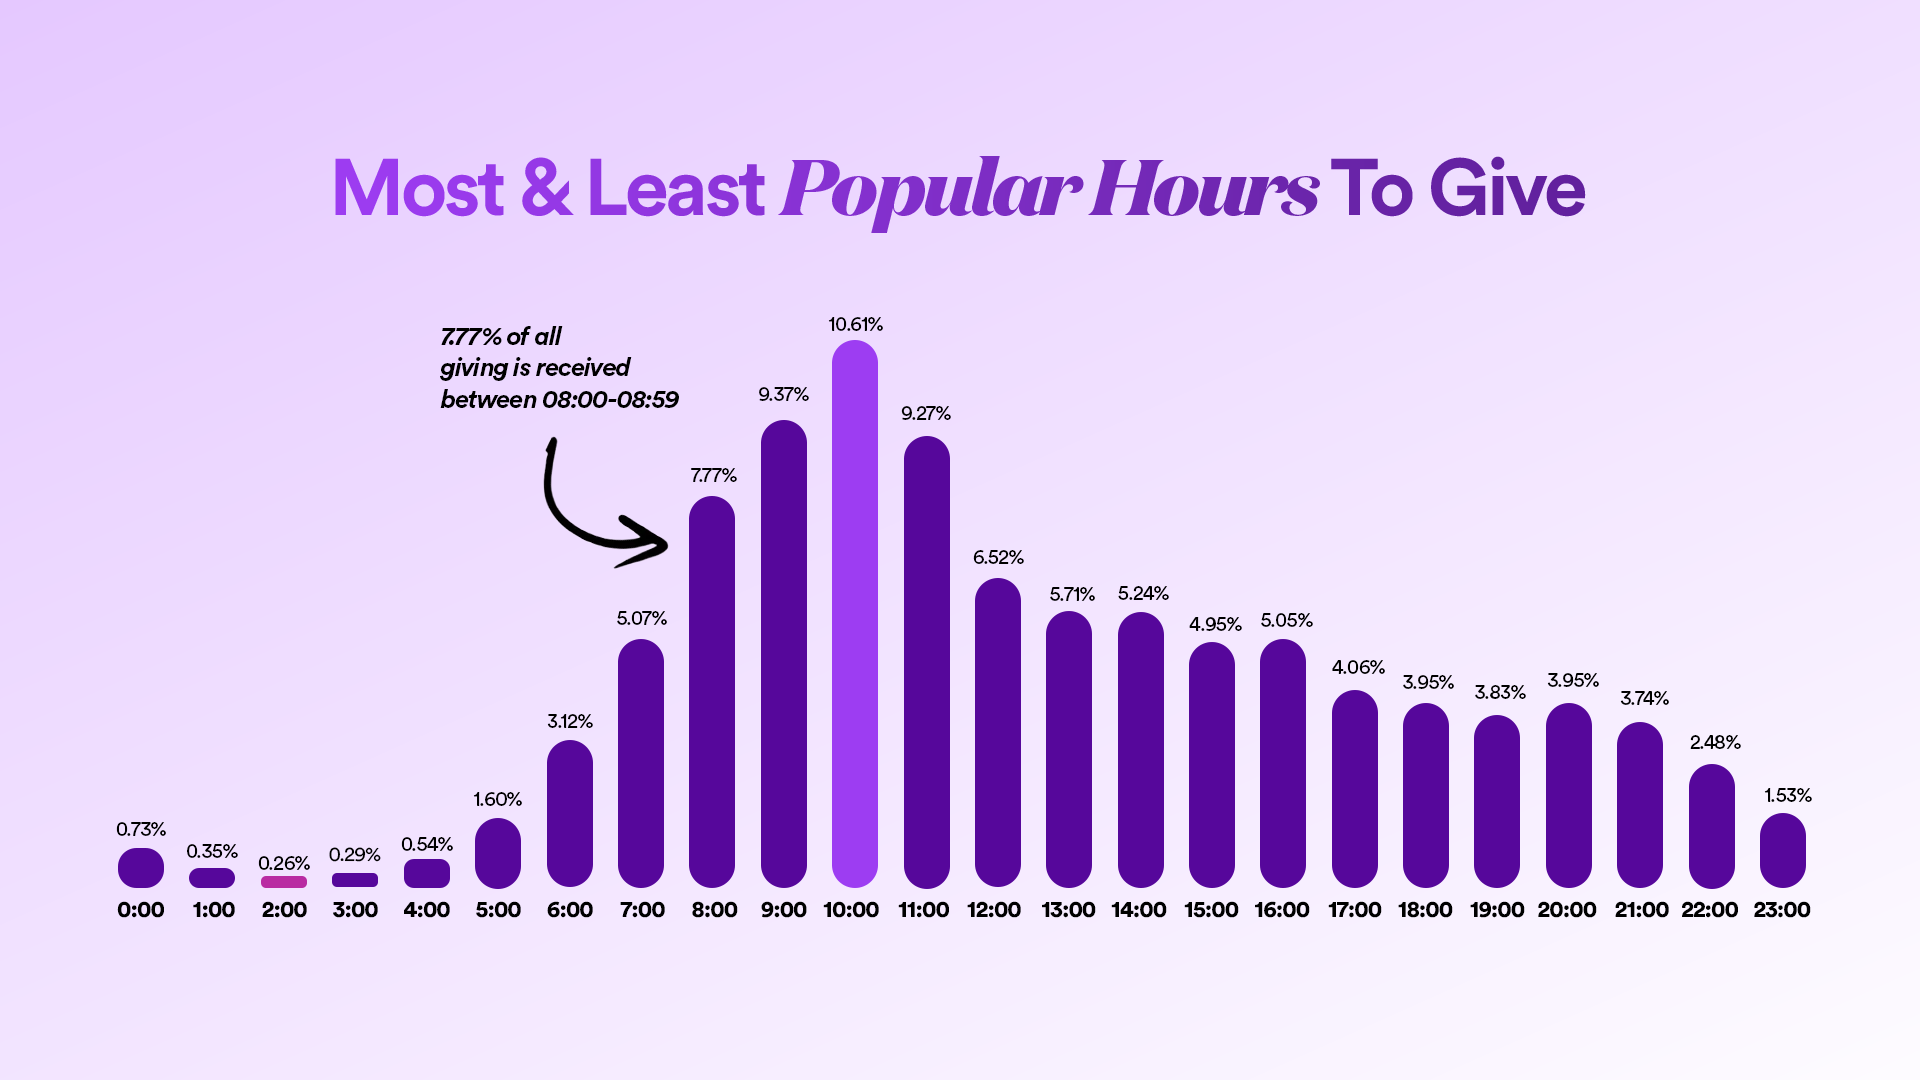
And finally, below you’ll find a diagram plotting out the most and least popular hours of the day to give. Notice the bump right around when most churches are having their weekend services on Sundays.
Most & Least Popular Hours To Give
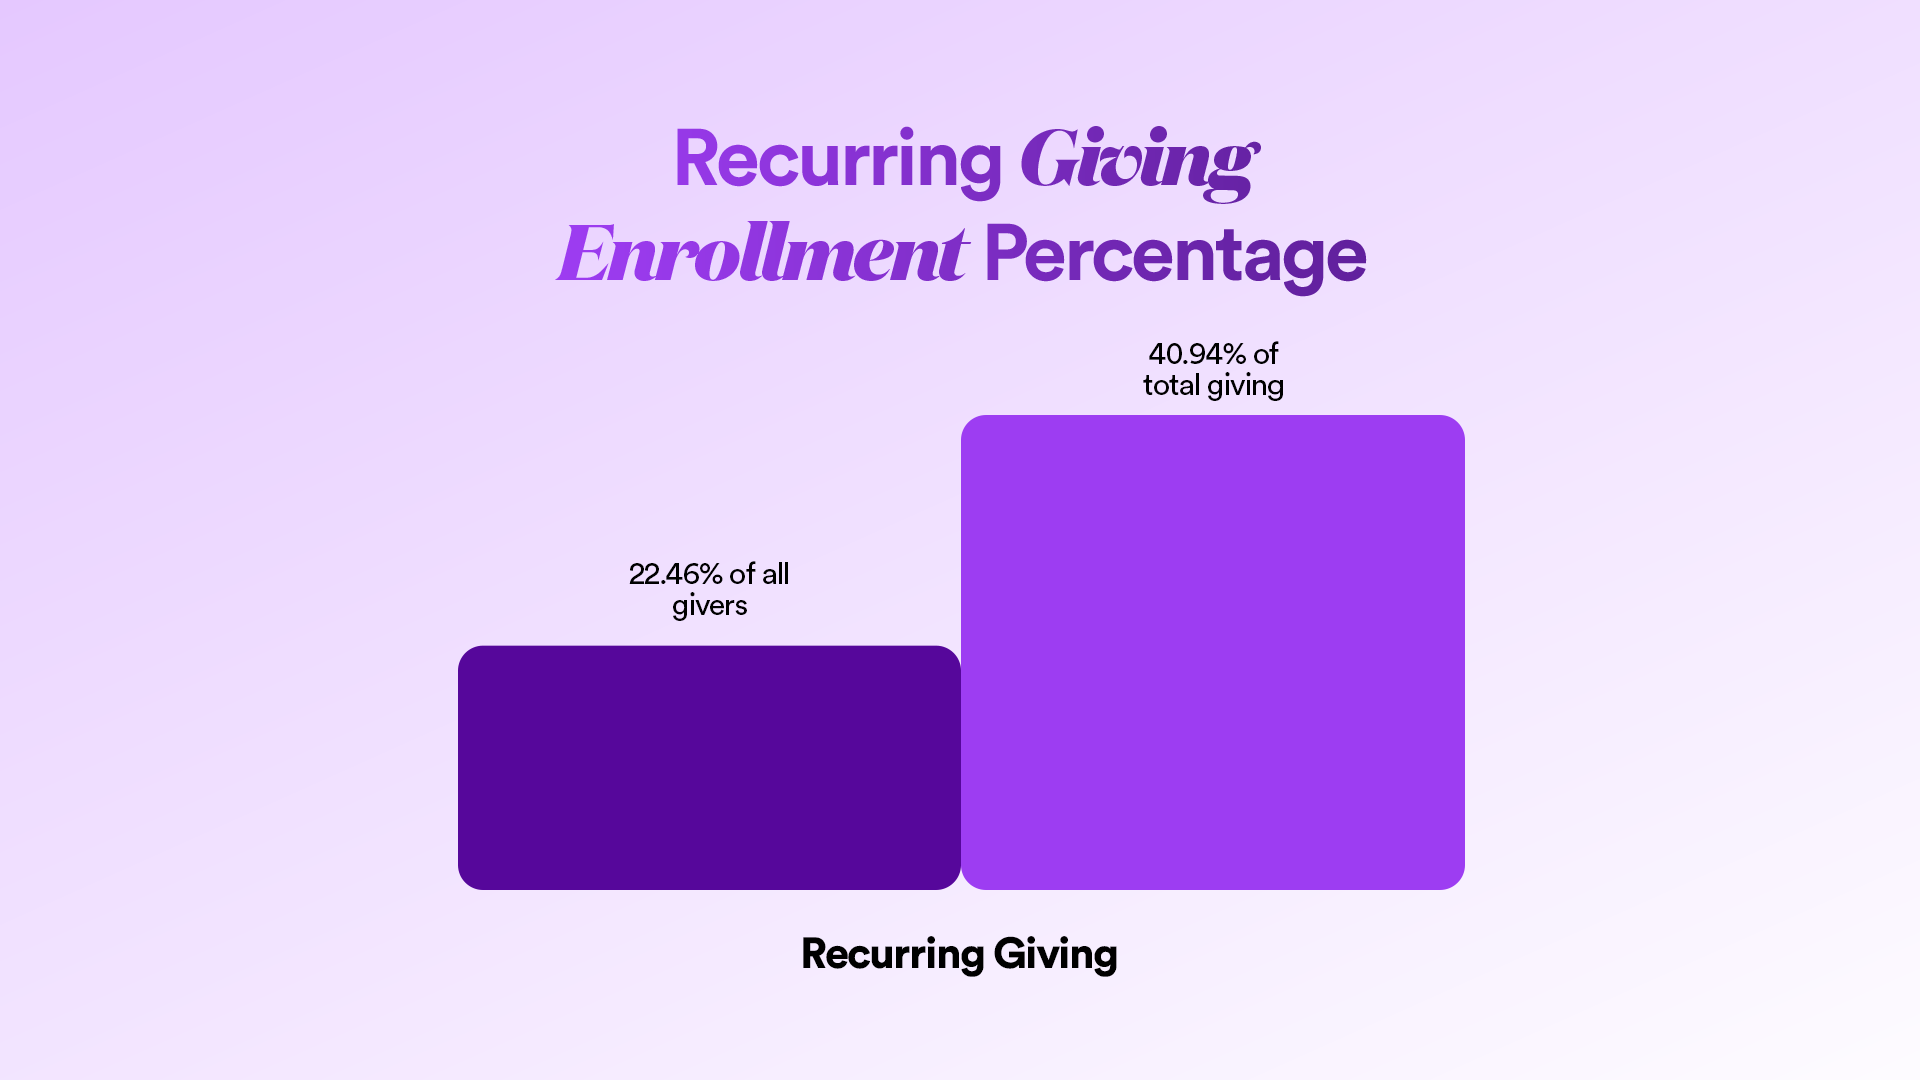
Church Giving Statistic #4 – Recurring Giving Enrollment Percentage
We ran the numbers, and 22.46% of all givers in our system are recurring givers. And that group packs a punch because they account for 40.94% of all giving.
Recurring Giving Enrollment Percentage
This dovetails off of Church Giving Statistic #2 and how it’s those weekly and monthly givers that are contributing the most to overall giving.
This is also why it’s so important to emphasize recurring giving options in your church. Just like you want people regularly involved in service, volunteering, small groups, and attendance – the same goes for giving. Consistency is what truly makes the biggest difference.
Church Giving Statistic #5 – Preferred Giving Methods
Here’s where things start to get even more interesting…
Let’s contrast some key figures by pitting bank account (ACH) giving against credit card giving.
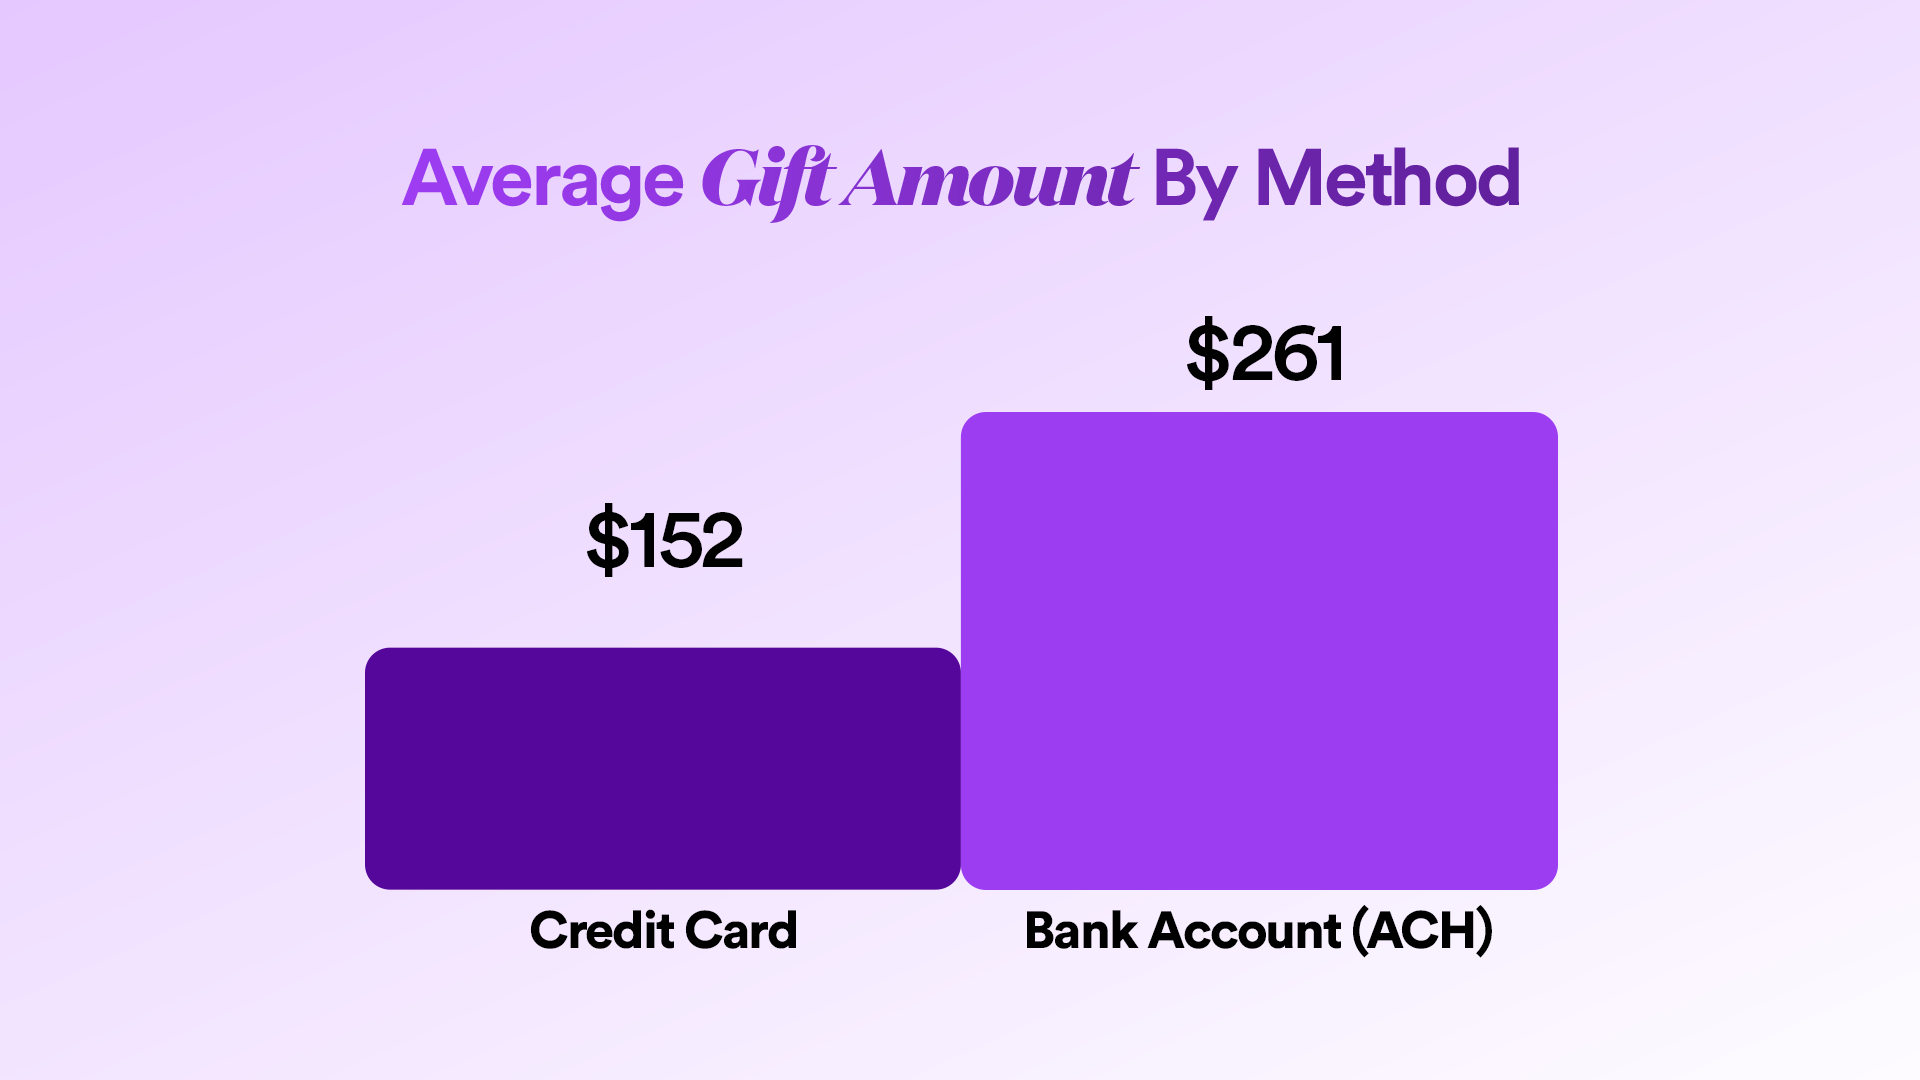
First, we’ll look at average gift size:
Average Credit Card Gift To A Church = $152
Average Bank Account (ACH) Gift To A Church = $261
Averag Gift Amount By Method
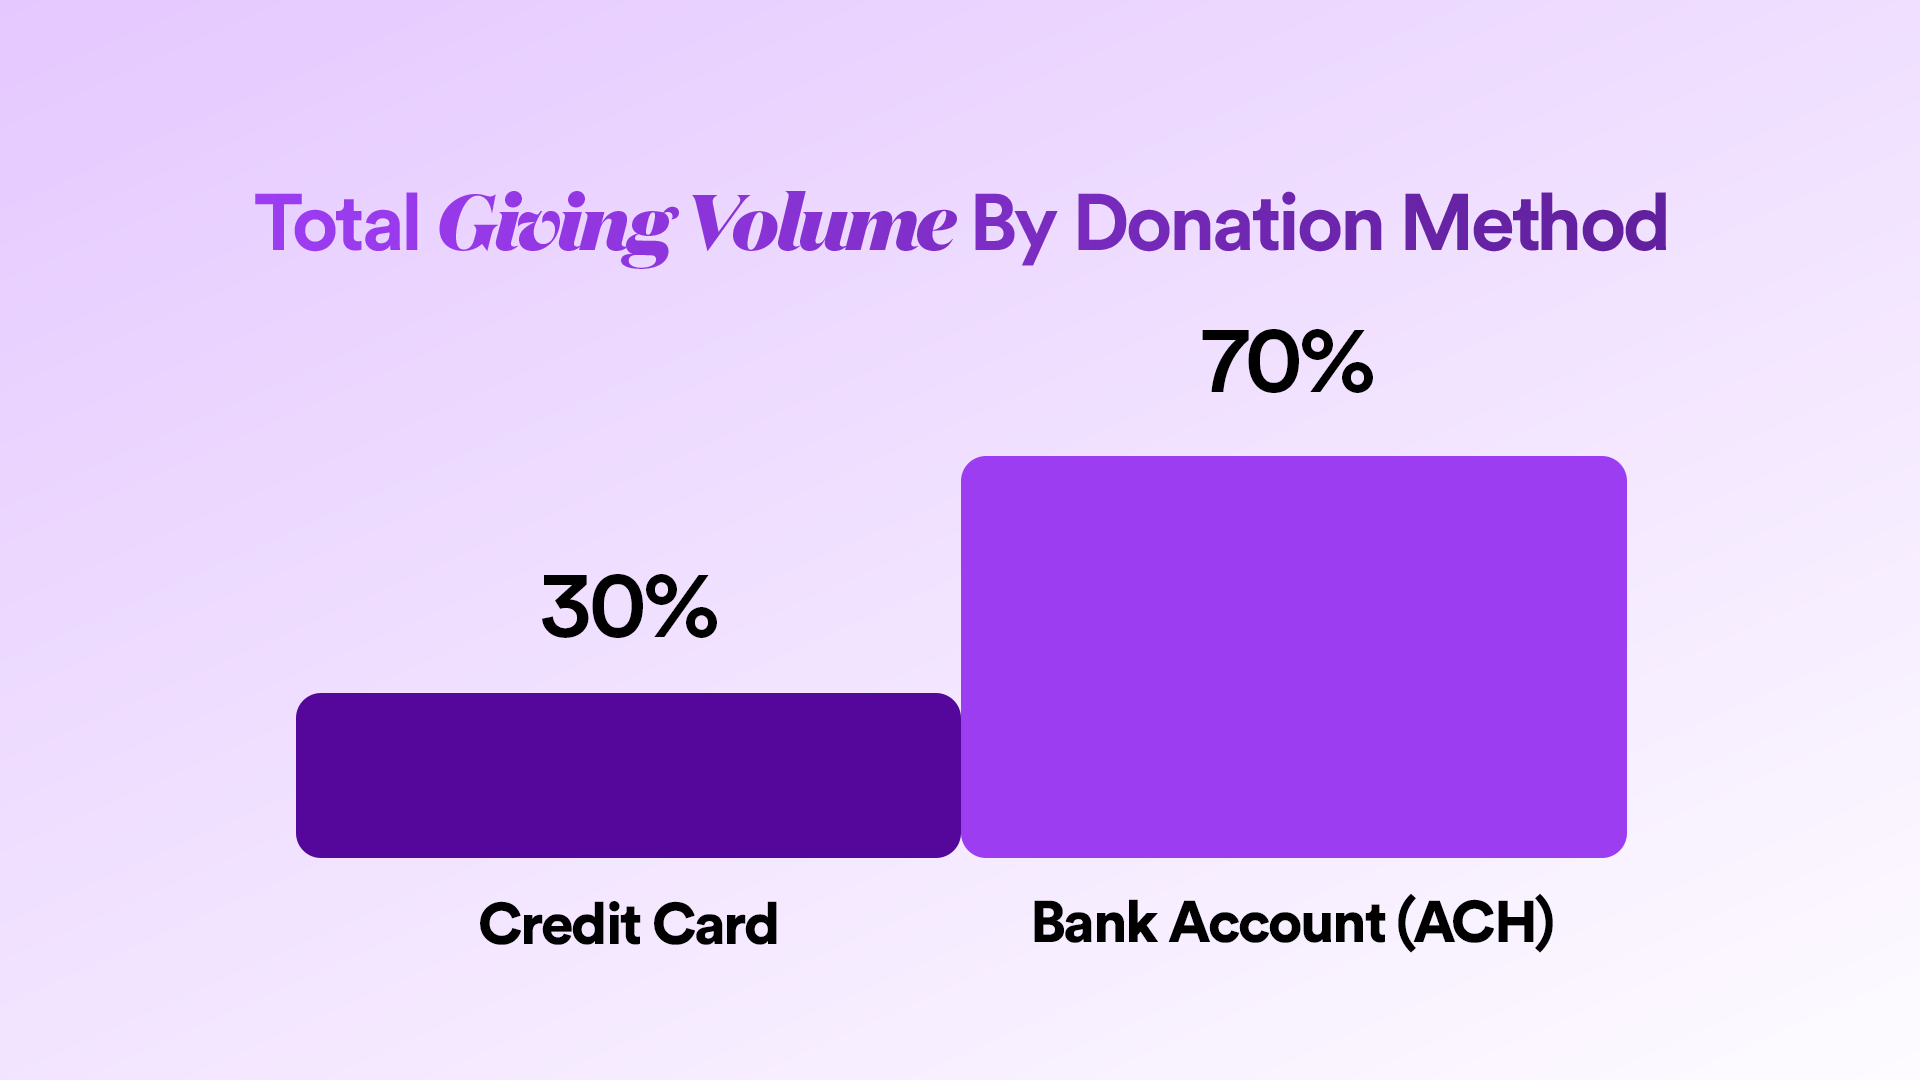
And now total giving volume in the calendar year by method of giving:
Total Giving By Credit Card = 30%
Total Giving By Bank Account = 70%
Total Giving Volume By Donation Method
Now, why is this interesting?
If you’re familiar with other church giving providers these numbers may come as a bit of a shock to you. Consider this from Tithely’s pricing page – where they note that only 30% of donors on Tithely give via their bank account.
Why such a big difference between Nucleus and Tithely's giving behavior?
Well, there’s actually a lot more to this story…
Church Giving Statistic #6 – Average Amount Of Donations Lost To Fees
If all we did was look at the Nucleus numbers we might conclude that 70% of donors prefer to give to their church via bank account.
Whereas if we just looked at Tithely’s numbers we might be tempted to claim just 30% prefer to give with their bank account.
How do we reconcile a 2.5X difference in data like this?
It’s actually quite simple: fees.
You see, while Nucleus and Tithely are both church giving platforms, their profit models couldn’t be more different (and we’re using Tithely as an example here, but the same could be said for Subsplash, Pushpay, Kindrid, etc.).
And it’s in the details of these profit models that we can begin to discern the differences in giving behavior.
Because at its core, donors are behaving precisely how each platform wants them to behave.
So it’s less about a donor intention and more about how they’re incentivized to give.
Nucleus does charge a monthly fee. But we don’t keep a percentage of every gift donated through our platform.
This distinct difference has big implications – namely, at Nucleus we encourage donors to give with their bank account (ACH). Why? Because bank account giving does not come with a percentage processing fee; credit card giving does.
Here’s how this plays out in practice:
Imagine you gave $100 to your church with your bank account – that would cost you $0.25.
If you gave that same $100 with your credit card – that would cost you $0.25 + 3% of the entire gift
So why the difference with a platform like Tithely?
Simply put, Tithely is a rev-share provider. And a rev-share provider earns their revenue from fees. From taking a part of every gift they process for themselves. This means they can’t realistically encourage bank account giving because it would dramatically affect their bottom line.
Or it means they would need to slap a percentage fee on bank account giving for the sake of not compromising their profit model (which is why it’s common to see church giving providers charge 1% for bank account giving needlessly).
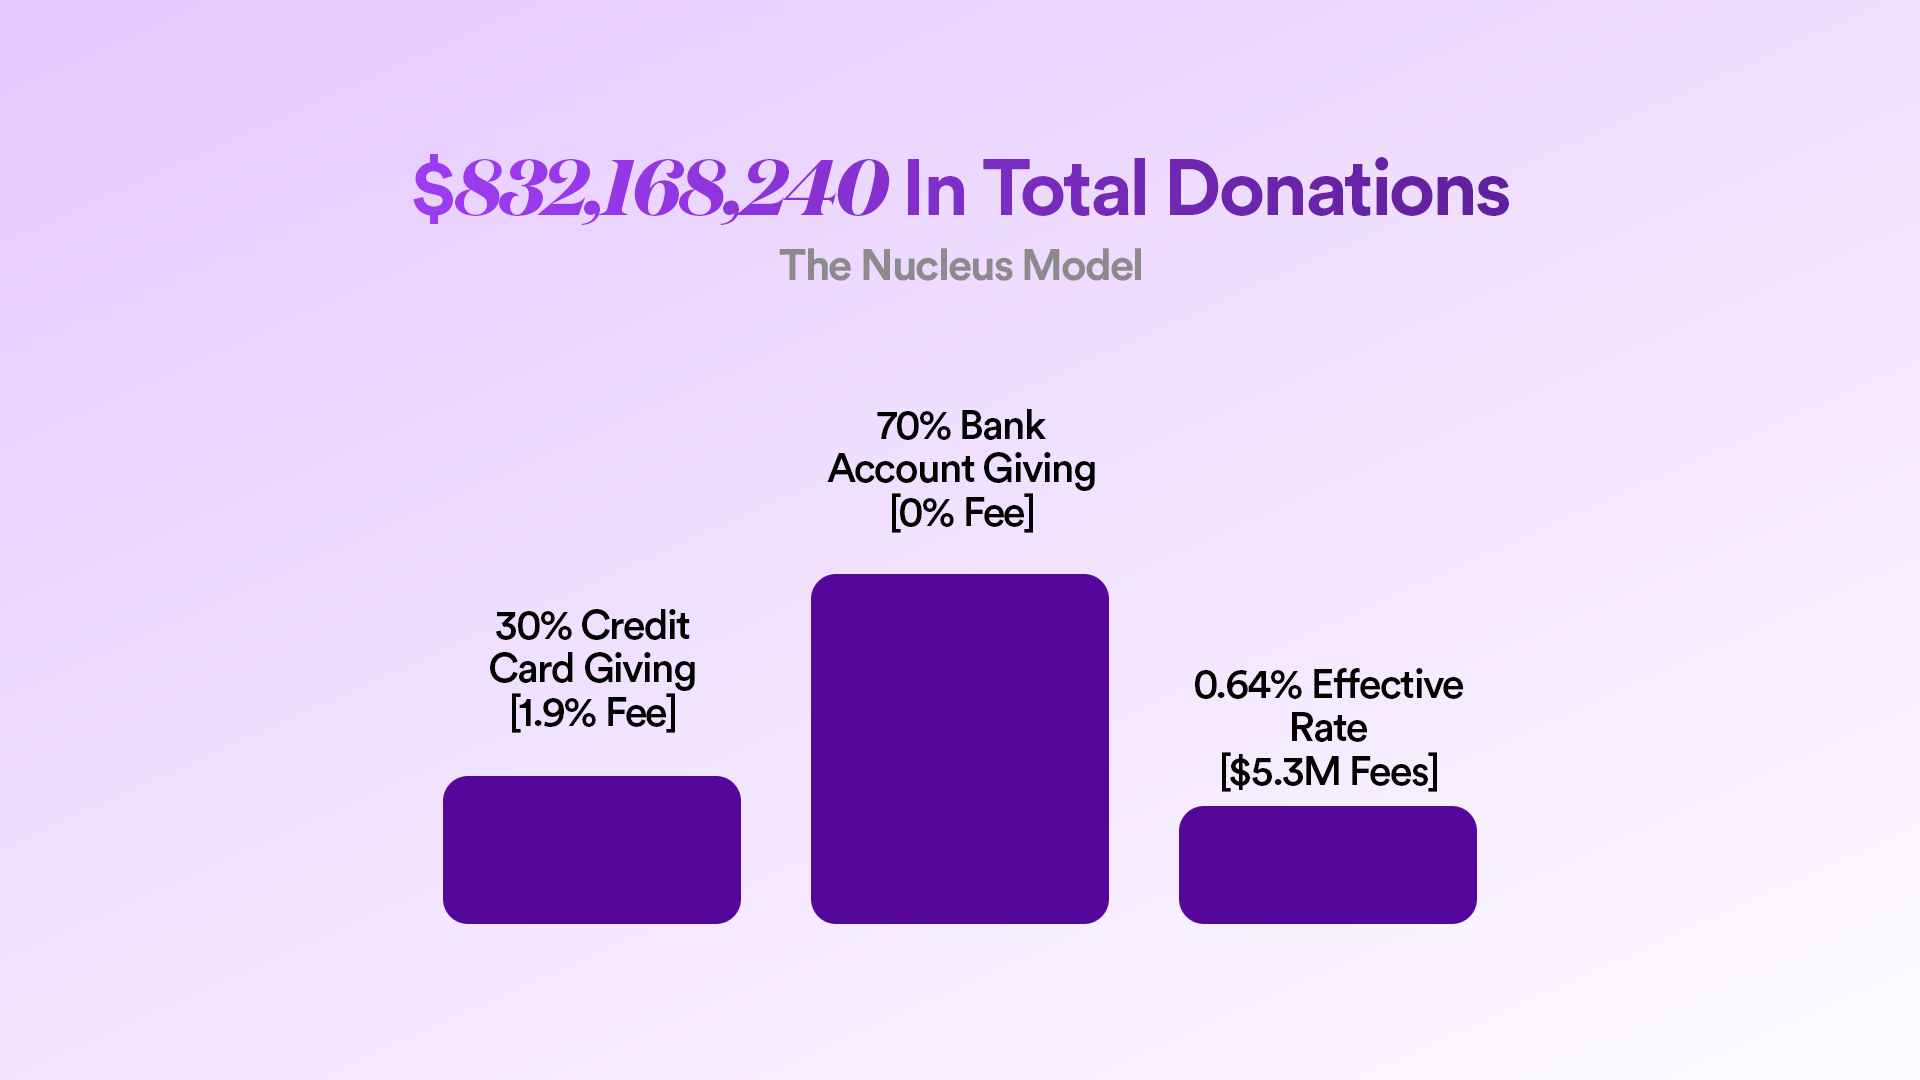
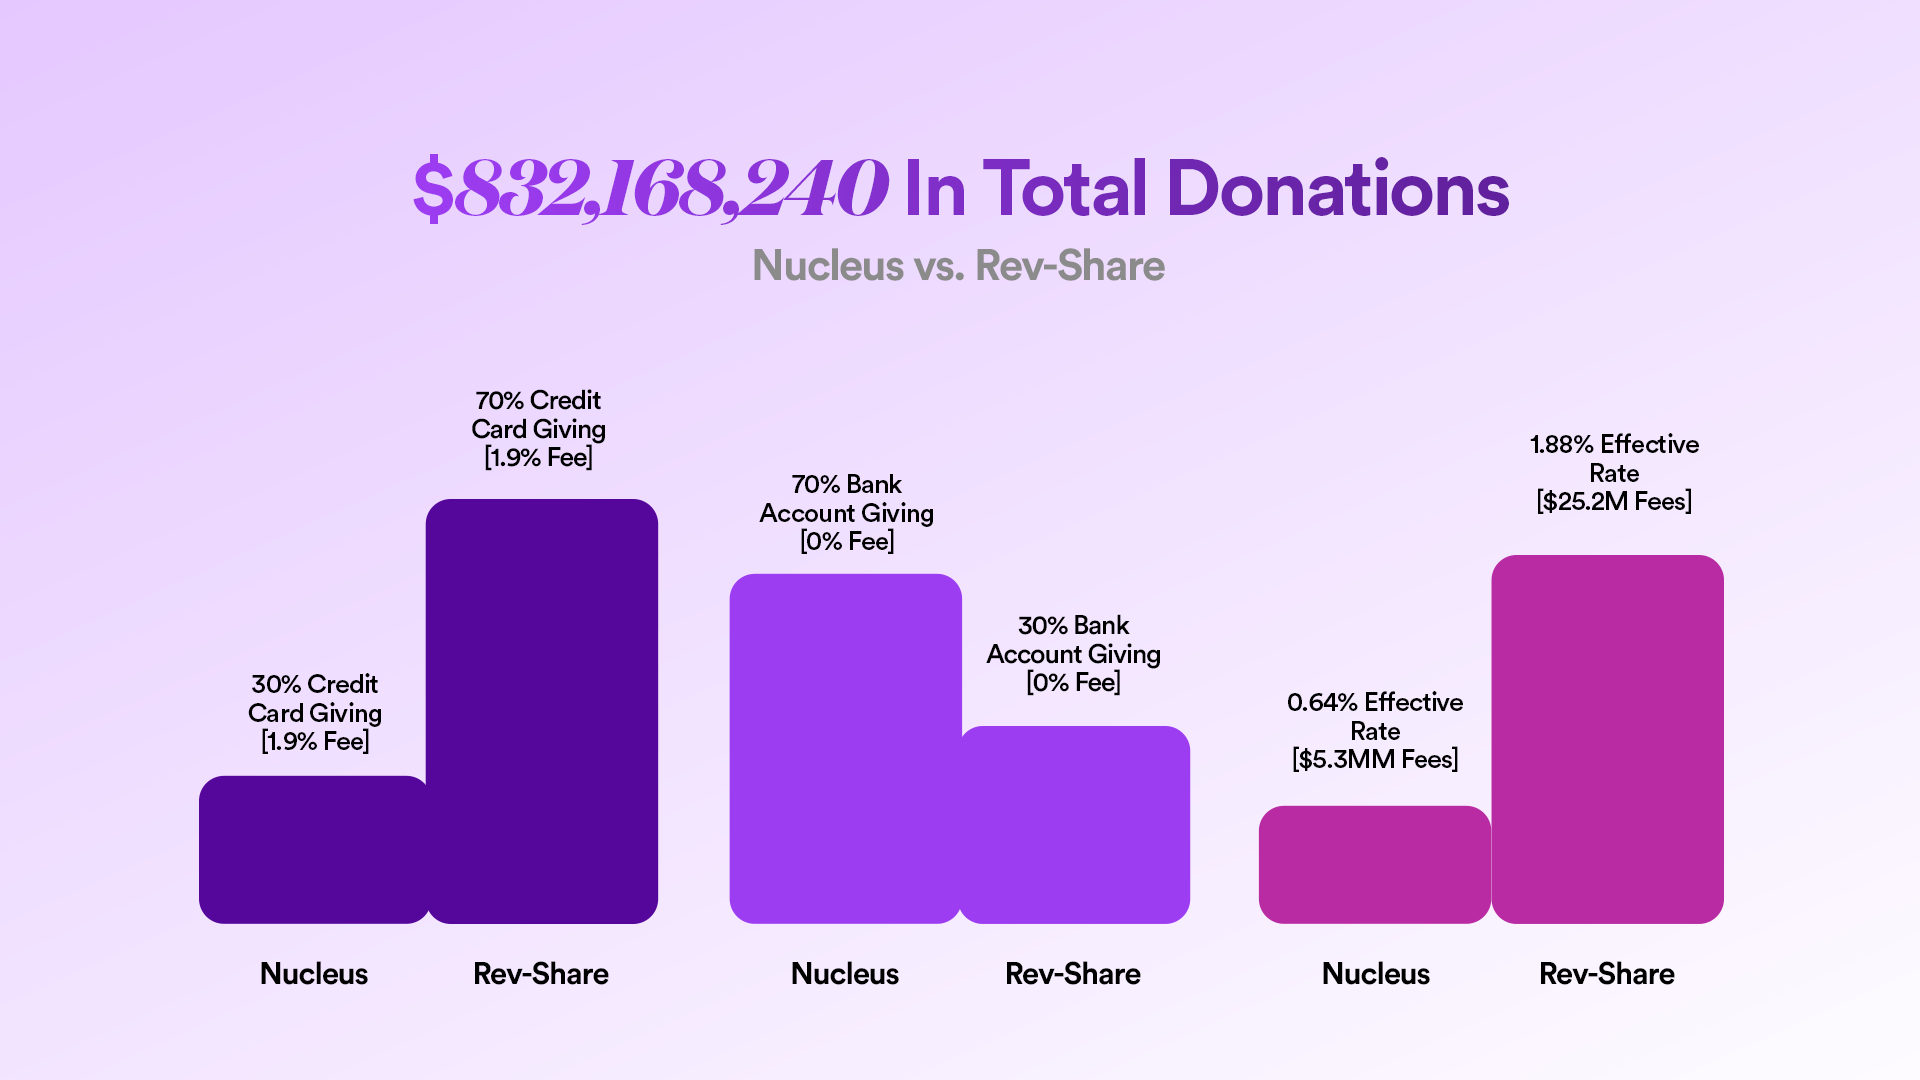
We’ll take the $832,168,240 in donations to churches that Nucleus processed as our figure for both examples. And we’ll compare our fees to a rev-share provider like Tithely to illustrate the difference in cost.
The Nucleus Model
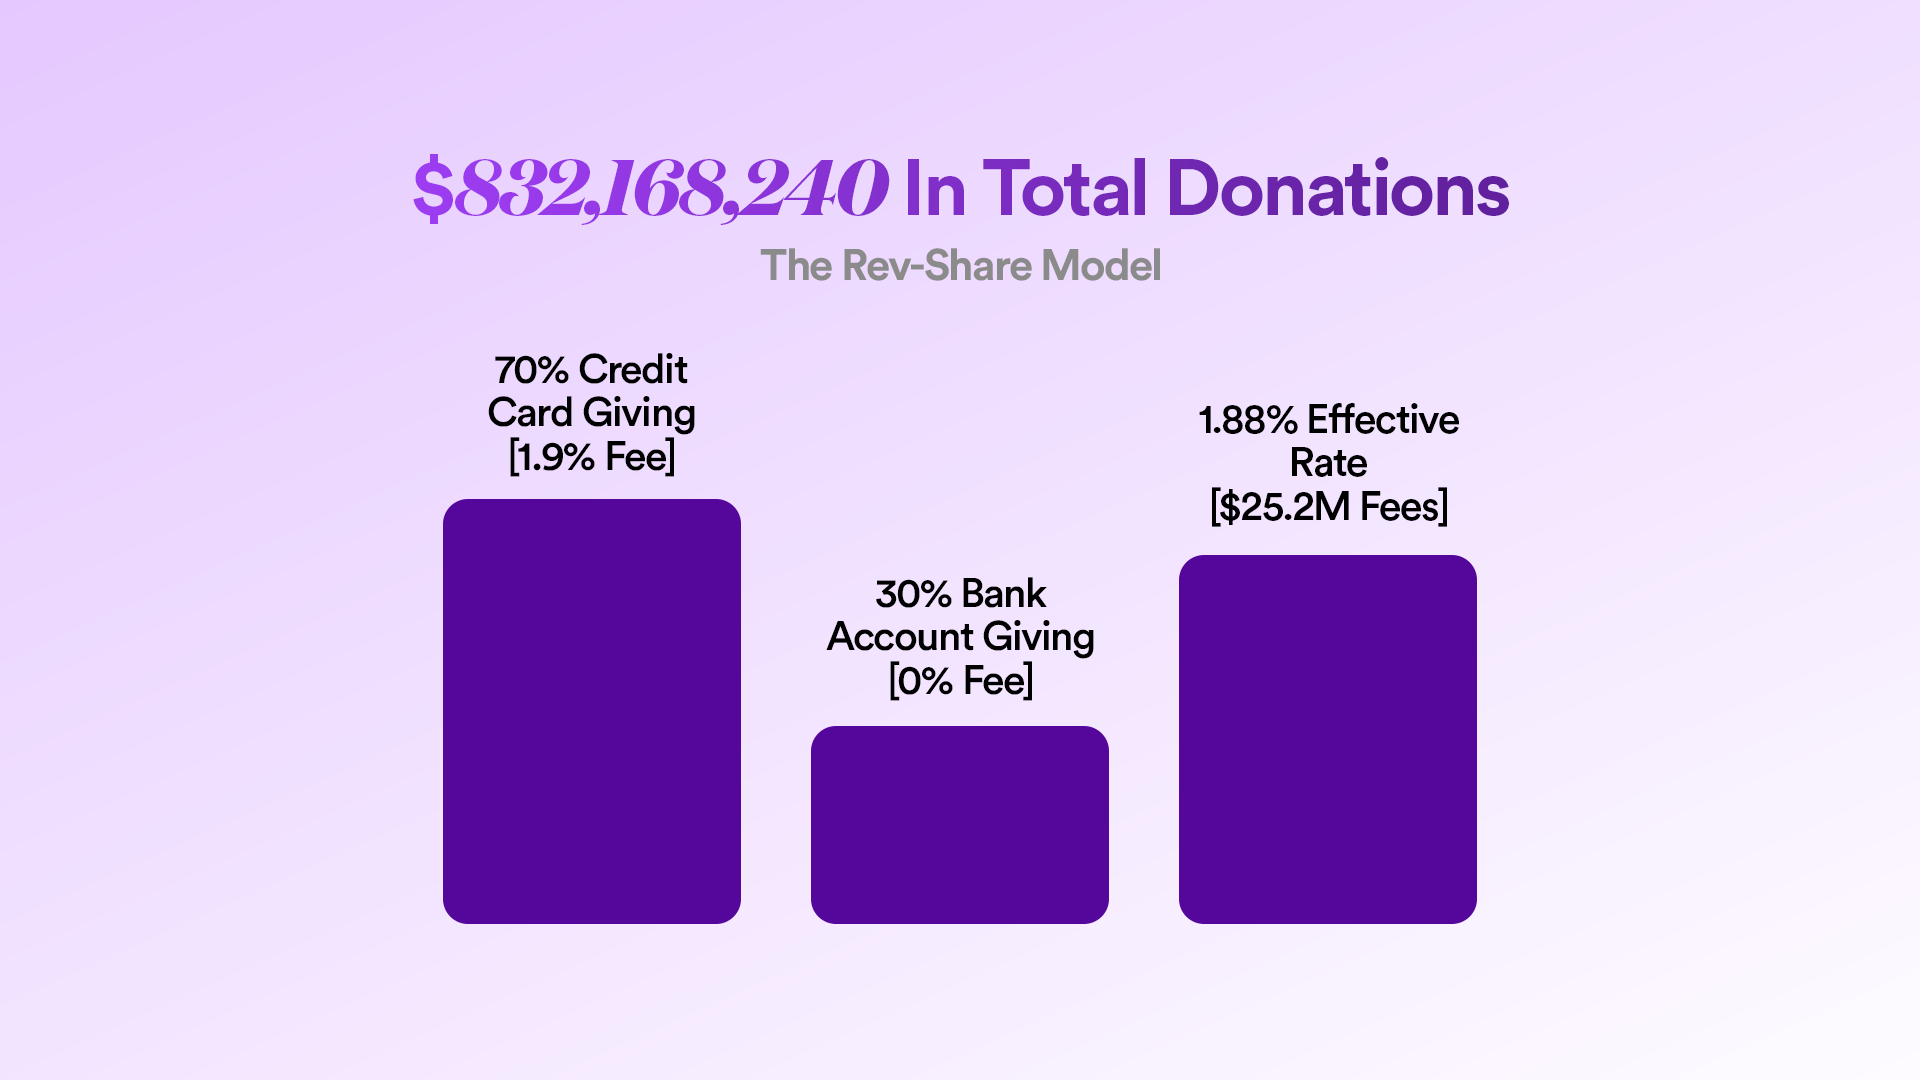
Now, let’s use that same total giving figure and run the numbers using Tithely’s splits between bank account and credit card giving and by charging Tithely’s fees:
The Rev-Share Model
And here’s an illustration showing both side-by-side – in the aggregate Tithely’s fees are almost 3X higher than Nucleus:
Nucleus vs. Rev-Share
NOTE: There are other fees to consider in any calculation like this – though they will always pale in comparison to percentage fees. Nucleus charges a monthly flat-fee based on church size that you can find here. Tithely does not charge a monthly fee. Nucleus and Tithely also charge per-transaction fees. Tithely charges $0.30 per transaction for both credit card and ACH gifts. Nucleus charges $0.25 per transaction for ACH only. To learn more, click here.
The Most Important Statistic You Need
If you leave this report with anything it should be this:
The values of your giving provider will dramatically influence the behavior of your church’s donors.
This isn’t a single statistic because it informs every statistic at once.
Consider this:
Donors on Nucleus Giving are 2.5X more likely to give with their bank account than donors on Tithely. This translates to churches and donors on Tithely paying 4X more in fees.
Why such a stark difference in donor behavior?
Is it because the congregations that use Nucleus are more predisposed to give with their bank account? No!
It’s because the platforms are designed differently. And giver behavior reflects that.
This is why it’s crucial when reading a report like this (or when parsing any data) to understand it contextually.
Donor behavior is not uniform.
On the contrary, my belief is that more than anything, donor behavior (and thus, data like what you’re seeing in this report) is shaped by your church’s values – and your giving partner is an extension of that.
{{banner-3}}
Free Bonus
Download The Church Giving Statistics Report 2026 – where we analyzed $832,168,240 in church donations